odini White Paper
White Paper
Odini is a robo-advisor(1) application which provides an automated investment service. It is intentionally designed to serve Thai people who would like to have a suitable investment. Odini belongs to Robowealth Mutual Fund Brokerage Securities Company Limited which operates under Thai SEC supervision. Also, the company officially participates in Thai SEC’s Wealth Advice for All(2) project. This white paper aims to provide a clear understanding of how odini works.
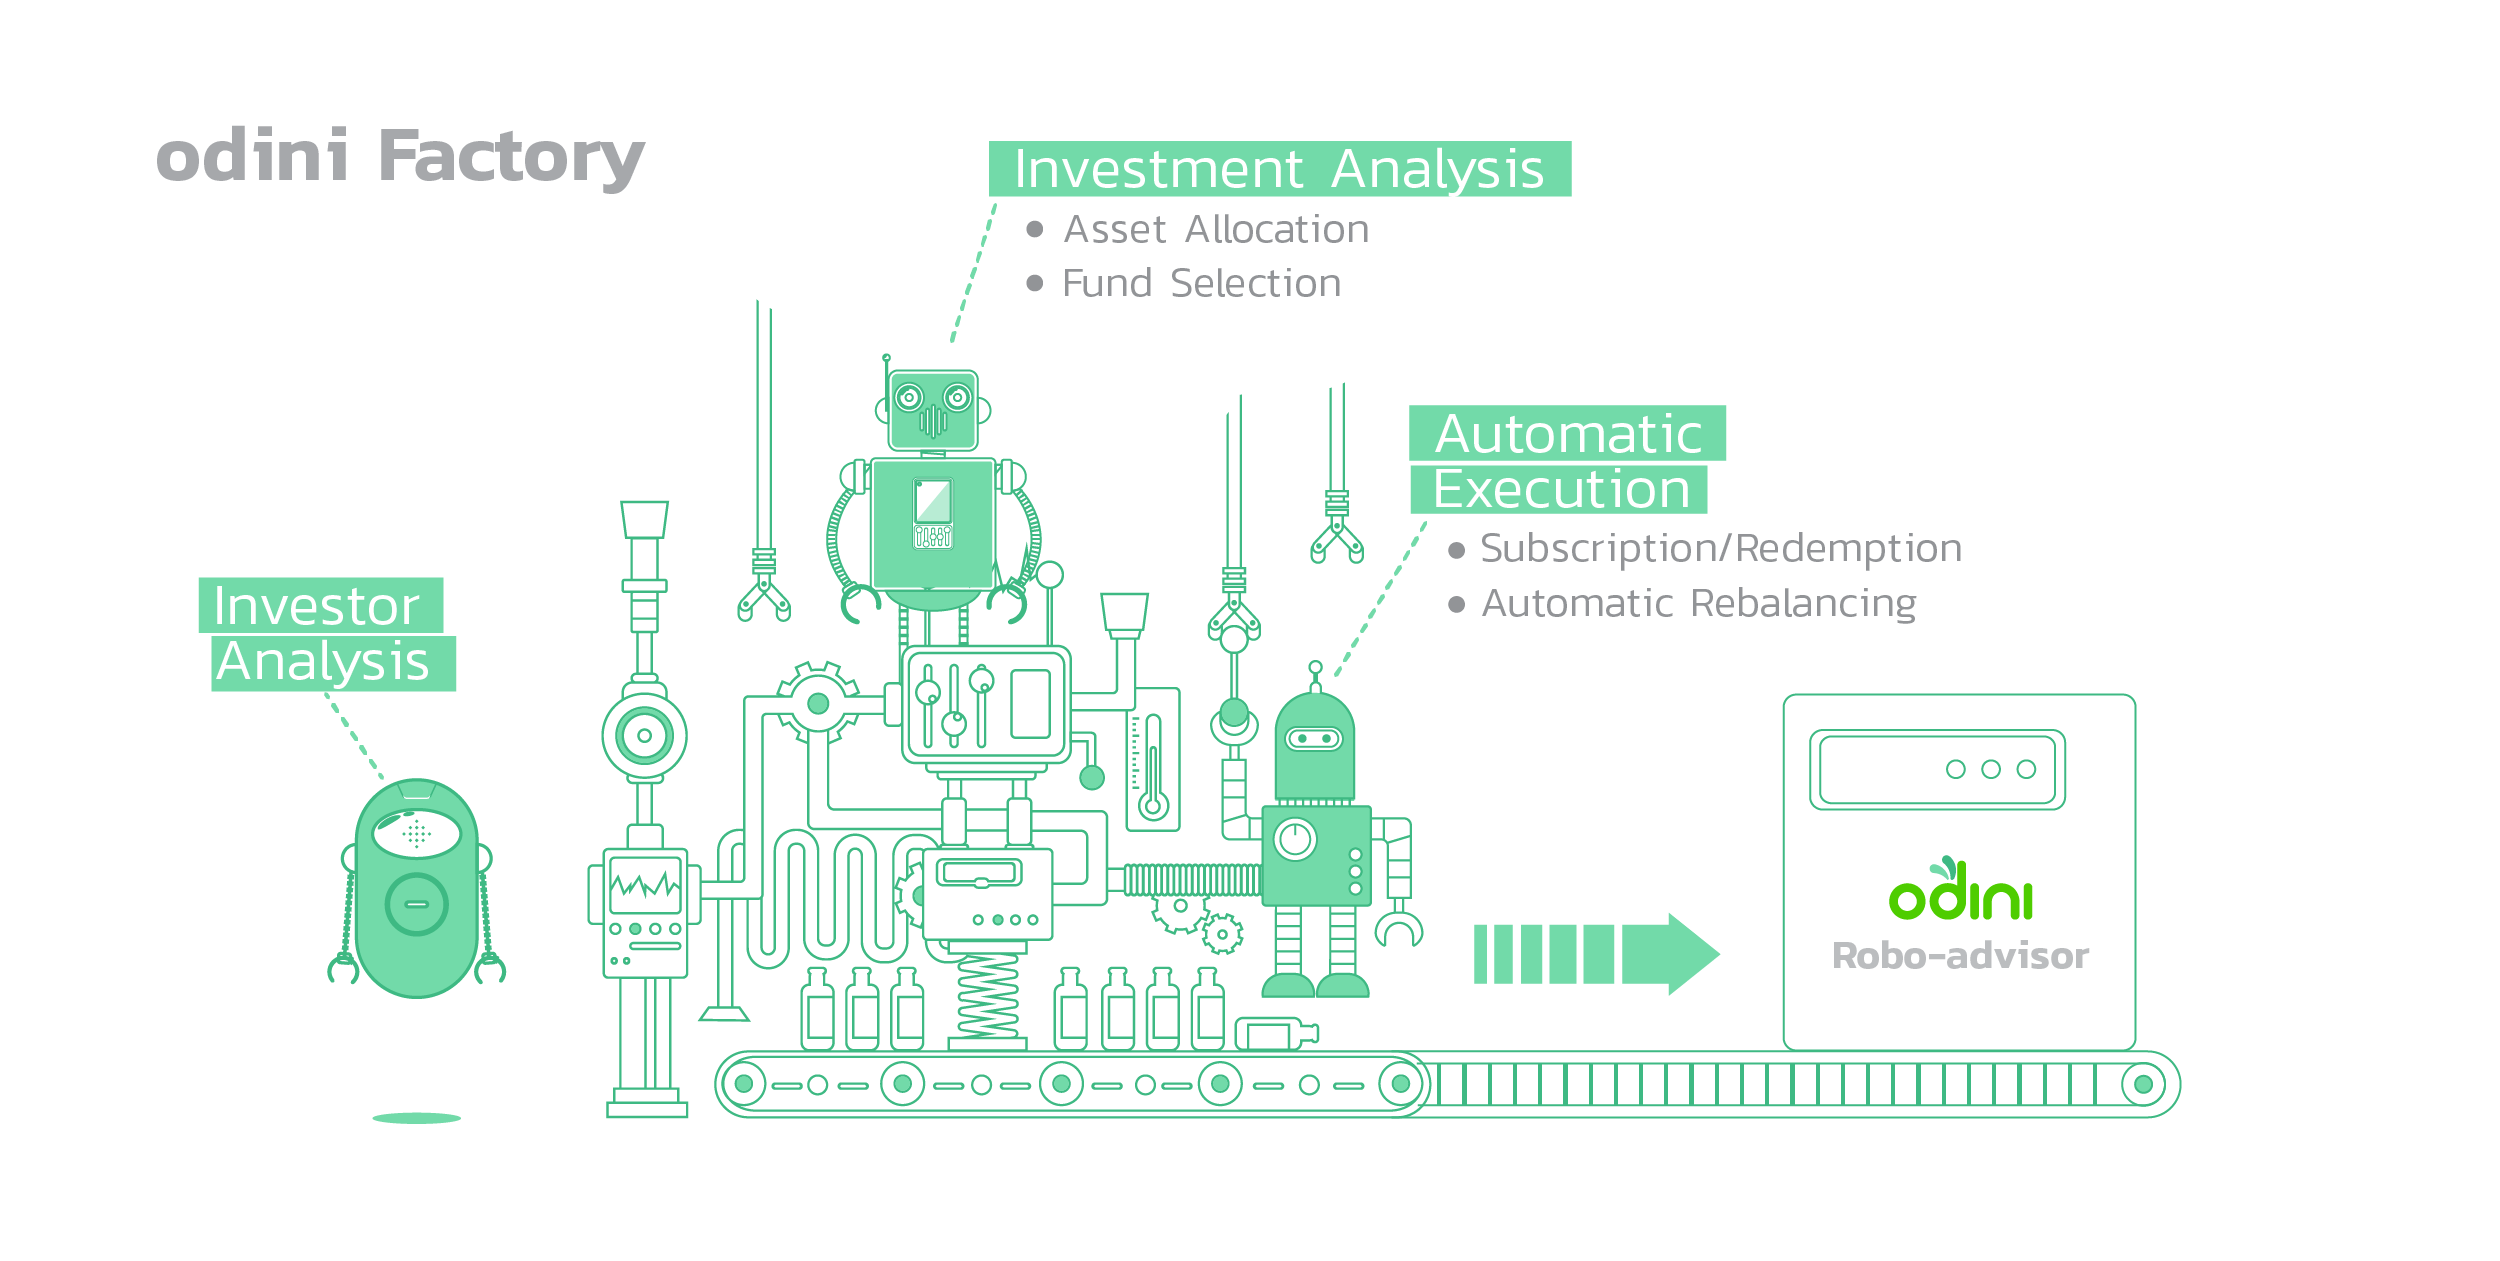
Since 2017, a dedicated team of financial professionals and tech specialists have been continuously developing odini mobile application. Overall, the application consists of three main engines which are Investor Analysis, Investment Analysis and Automatic Execution.
Before jumping to other parts in this white paper, it is worth noting that every part of the odini is precisely built on these three concepts;
• Simplicity: Intuitive user experience with friendly user interface on smart phone
• Convenience: Paperless account opening process and automated transactions
• Reliability: Top-notch quant models modified to comply with local ecosystem
(1)The term “robo-adviser” generally refers to an automated digital investment advisory program. In most cases, the robo-adviser collects information regarding your financial goals, investment horizon, income and other assets, and risk tolerance by asking you to complete an online questionnaire. Based on that information, it creates and manages an investment portfolio for you. – US SEC
(2)Wealth Advice for All project is introduced by Thai SEC to promote accessible investor-centric advice & investment solutions for long-term well-being.
Part 1: Investor Analysis
Typical Thai investor generally invests in an extremely conservative portfolio which mainly consists of bank deposits and some fixed-income securities. Although this portfolio’s return is stable, there is a risk that the long-term rate of return might be less than inflation rate. Odini aims to manage this inflation risk by providing a set of optimal portfolios whose expected returns are significantly greater than long-term inflation rate.
In every month, five portfolios are optimized to deliver the lowest possible risk given five levels of target return. Main objective of the investor analysis is to guide each investor the suitable portfolio to invest in. To achieve this task, two-step questionnaire is designed to collect information based on financial goals, risk tolerance and investment horizon.
Customer Portfolio Mapping
If an investor has a high risk tolerance level, more risky asset can be added to the portfolio in order to provide higher expected return. However, this high risk portfolio may experience some lost in short-term as risky asset usually has a large fluctuation in price such as high volatility in stocks. Effectively, this risk can be reduced by extending the investment horizon since the return of stock market tends to have a mean-reversion characteristic.
(3) Mean-reversion is a theory suggesting that return of each asset class tends to converge to its historical mean or average value.
Part 2: Asset Allocation
Asset allocation is simply the way to determine weight of each asset class that is suitable for each investor according to risk tolerance and investment horizon. For odini, there are five sets of asset allocation categorized by risk level which are conservative, moderately conservative, moderate, moderately aggressive and aggressive.
The main objective is to minimize risk of each portfolio given target annual return of 4% for conservative portfolio to 12% for aggressive portfolio. In optimization process, portfolio risk is quantified by Conditional Value at Risk (CVaR) technique which effectively incorporates fat-tail risk. The process starts with Strategic Asset Allocation (SAA) which aims to form a core portfolio consisting of local f ixed income and local equity. Below chart displays core portfolio of each risk level.
Strategic Asset Allocation
It is clearly stated in the chart that the higher target return we expect, the more allocated equity weight. This equity investment involves risk as stock price is typically fluctuated in short-term investment horizon. Based on the static weight of core portfolio derived from Strategic Asset Allocation process, we can plot historical return of each portfolio from 2007 to 2017. Below table and chart can effectively represent risk-return profile of each portfolio.
Historical Annual Return of Core Portfolio 2007 – 2017
Conservative portfolio can generate positive return in every single year. However, it can provide only 4.11% Compound Annual Growth Rate (CAGR) since 94.40% of portfolio is allocated to fixed income investment. In contrast, aggressive portfolio can produce CAGR of 10.79% in long-term but it experiences worst annual return of 32.74% during 2008 global financial crisis. However, all loses from 2008 are fully recovered just one year later and the profitable years are extended for 4 consecutive years.
To demonstrate risk-return profile of each portfolio more precisely, monthly value of each core portfolio is presented in below chart. Conservative and moderately conservative portfolios contribute smooth growth of value which are suitable for investors with low ability to take risk. Except for Hamburger crisis in 2008, aggressive and moderately aggressive portfolios experience several short-term dips in 2011, 2013 and 2015.
Historical Portfolio Value of Core Portfolio 2007 – 2017
Next step for asset allocation is to enhance risk-return profile by utilizing Tactical Asset Allocation (TAA). The objective is to distribute core portfolio investment into broader asset classes according to investment outlook. Given machine-generated TAA, Investment committee is responsible for approving weight of each asset class. Type of each as set class and historical return are presented in the following tables.
Asset Class Universe for Tactical Asset Allocation and its Proxy (Total Return Index)
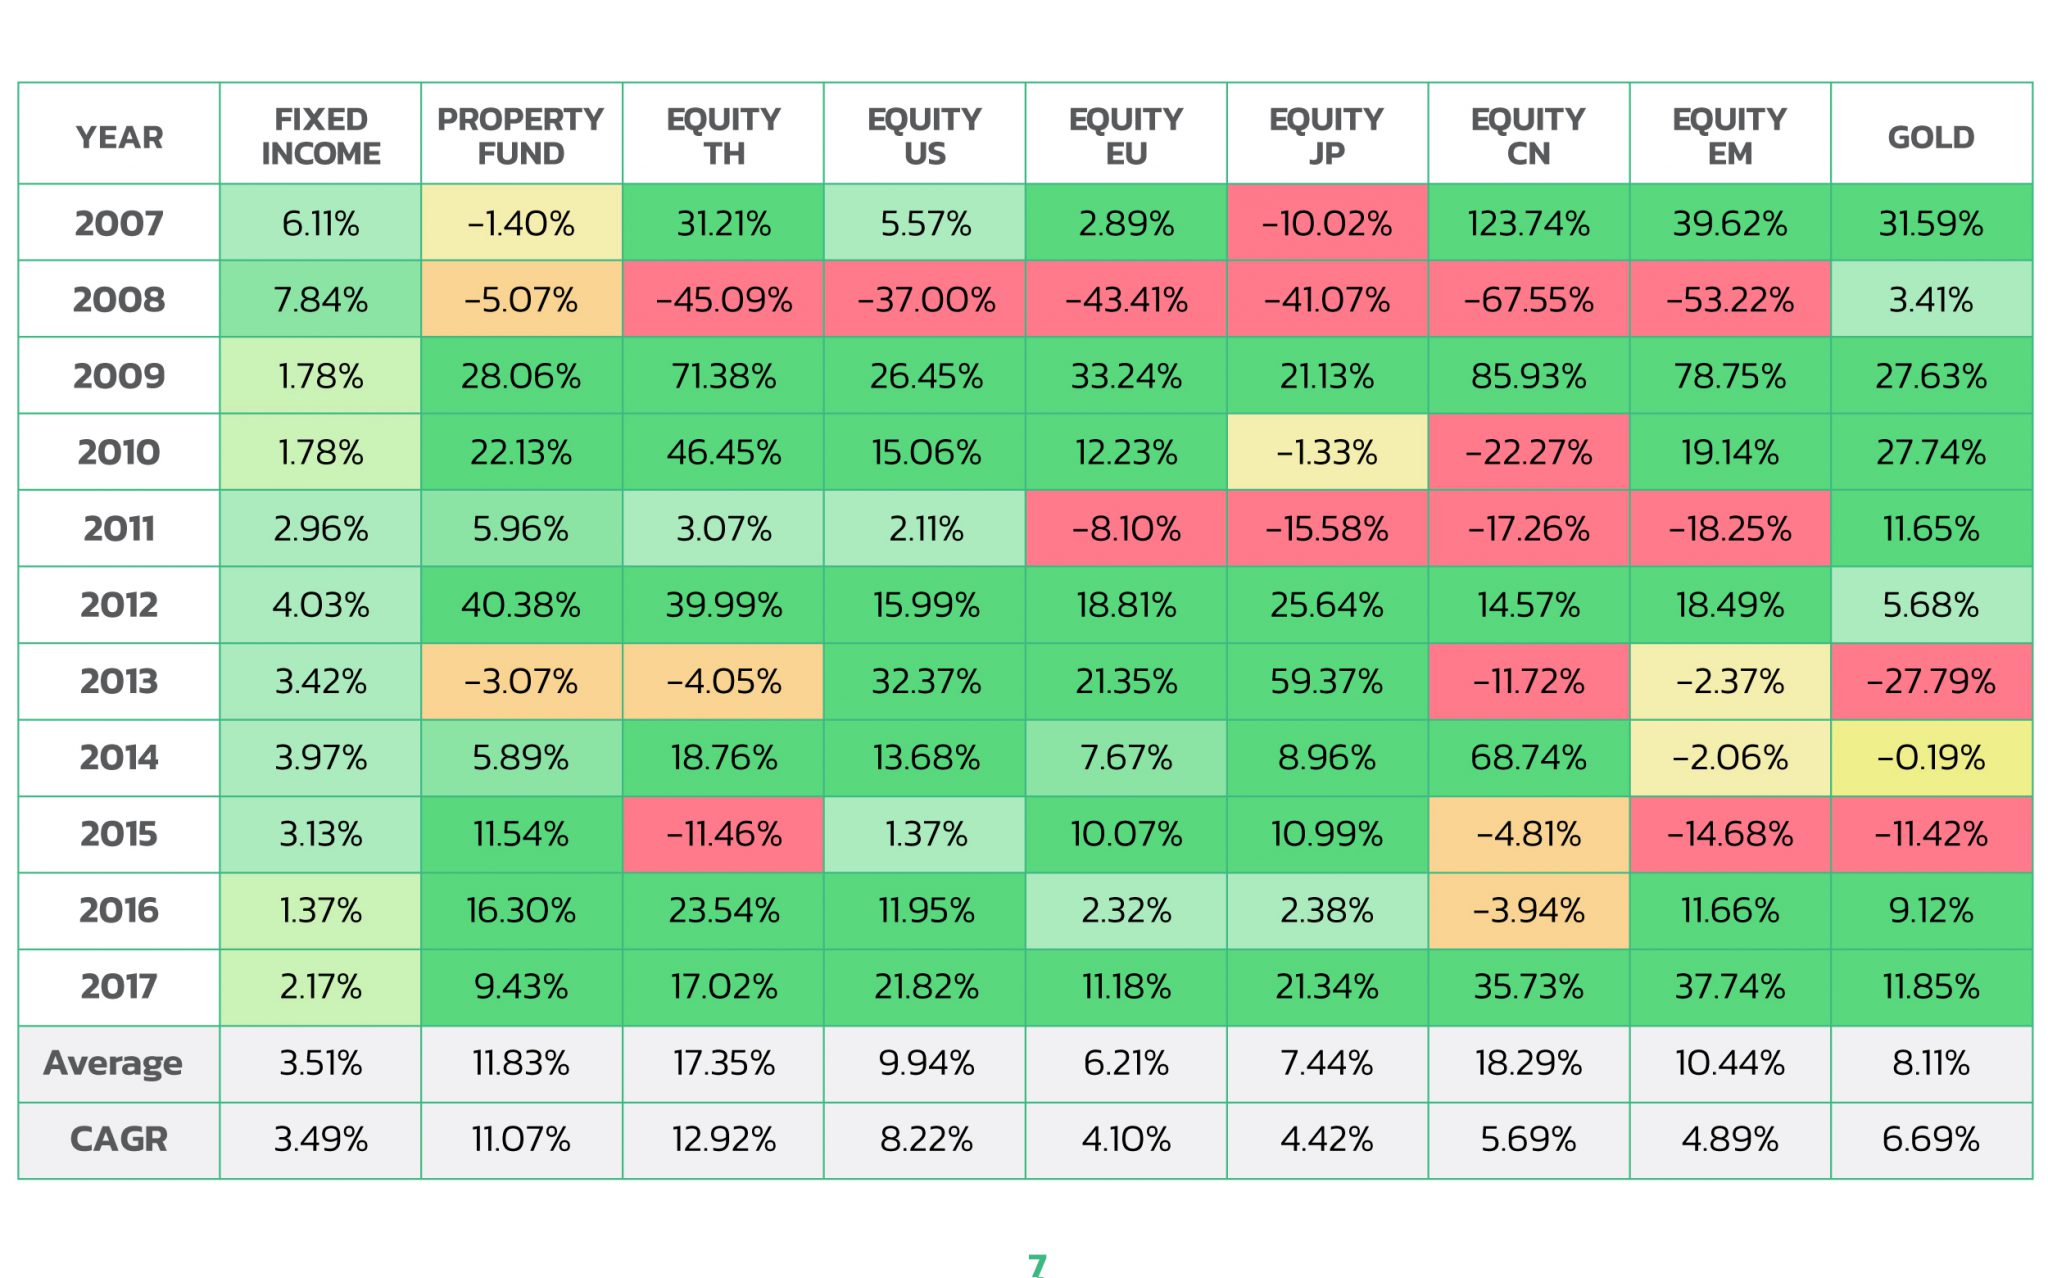
Before digging into details of TAA we use, it is worth noting to explore annual return of each individual asset class in the following chart. Surprisingly, Thai equity and property fund show highest return of 12.92% and 11.07%, respectively.
Historical Asset Return 2007 – 2017
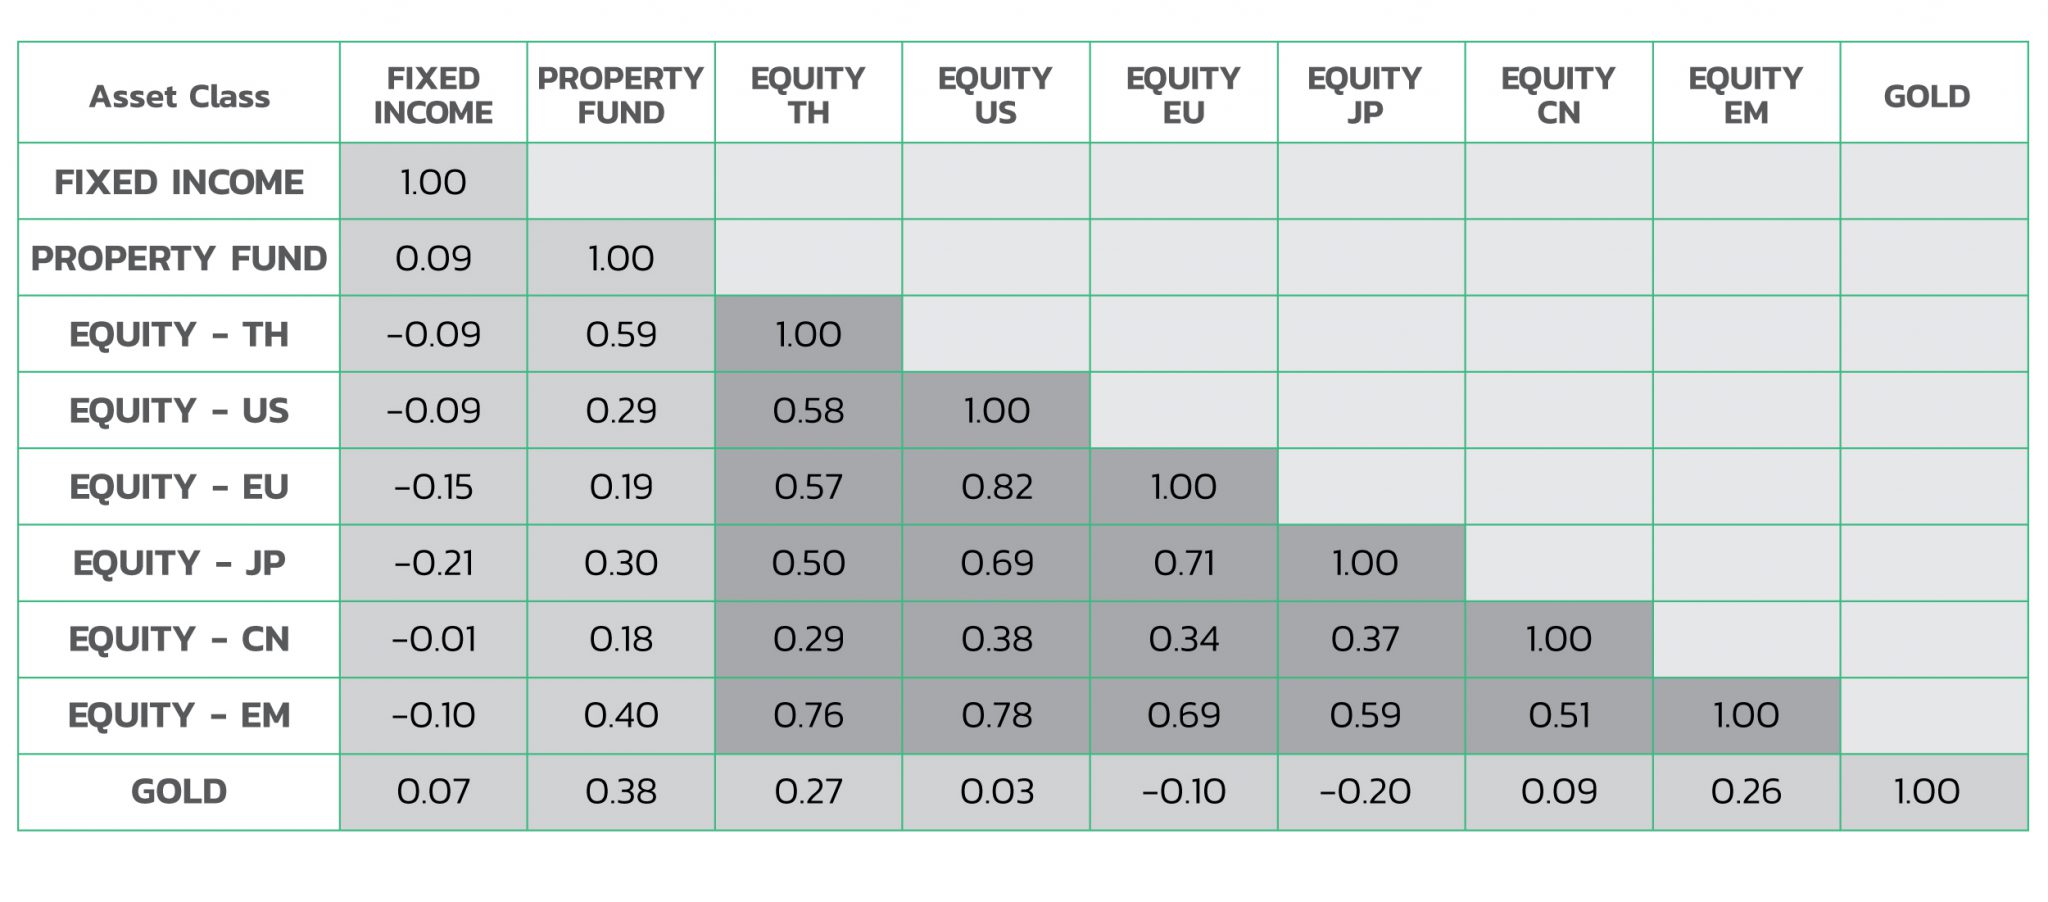
From 11 years of analysis, there are three years when each and every asset class shows positive return. As a Thai investor, diversification to developed countries’ equities (US, EU and JP) can ease short-term dips in 2013 and 2015. To understand relationship among asset classes, correlation of possible asset pair calculated from monthly return from 2007 to 2017 are presented below.
Correlation Matrix of Monthly Return 2007 – 2017
In odini quantitative model, TAA dynamically adjust weight of each asset class according to its outlook 1-year outlook. Assets with relatively promising outlook would be assigned more weight (overweight) while assets with relatively poor outlook would be assigned less weight (underweight). The nature of this portfolio tilting technique makes TAA sometimes called dynamic asset allocation. Final weights are computed from Black-Litterman model developed by Fischer Black and Robert Litterman.
Historical Portfolio Value of Tactical Portfolio 2007 – 2017
According to empirical results from forward testing, TAA return can be effectively enhanced from SAA across all portfolios. For investment risk, all portfolio except conservative have lower Standard Deviation (SD) of monthly return. To reflect true performance in the real world, transaction fees from mutual fund subscription and redemption are already taken into account.
In conclusion, final portfolios generated by TAA can provide higher return over a long-term investment horizon and it can also reduce short-term fluctuations. This superior set of portfolios is the result from extra diversification and dynamic weight adjustment of each asset class according to its outlook.
Part 3: Mutual Fund Selection
Once the target weight of each asset class is determined from the TAA process, next question is that What mutual funds should we select for each asset class? The first task to answer this question is deciding to go for passive fund or active fund style. By design, passive fund’s objective is to track the performance of its specified benchmark as close as possible. In contrast, active fund scheme incentivizes the fund manager to actively manage portfolio to contribute extra return over the benchmark.
In each asset class, an empirical study is executed to check if top performing funds can consistently outperform the benchmark. If they can keep beating the benchmark, it supports the idea to prefer active fund to passive fund. In opposite, passive fund is preferred if top performing funds fail to beat the benchmark in the following periods.
Selected Mutual Fund Management Style of each Asset Class
In global markets, passive fund style has been gaining a favorable momentum over active fund due to very low cost structure and relatively higher level market efficiency. Therefore, odini selects passive funds to represent all foreign equities and gold. For each mentioned asset class, a passive fund with minimal tracking error and low fees is selected on a monthly basis. This small deviation from benchmark may reflect an efficient fund management and/or low cost charged to investors.
In Thai markets, there is not enough fund of property funds to perform the empirical study. Therefore, our investment committee qualitatively pick the most optimal fund to represent this asset class. For local fixed income and equity, active funds are selected since odini has discovered the quantitative method to pick funds that can significantly outperform the benchmark.
The methodology we employ to pick active funds in fixed income and equity class is based on the following hypotheses
• Best fund with consistent decent performance compared with other funds will continue to consistently outperform the benchmark over the next period.
• A combination of funds that provide a consistent decent performance can contribute a better risk than the best single fund.
To start the process, return over the past 3 months, 6 months and 12 months of each fund is calculated to measure the performance. For each time horizon and each individual fund, a percentile rank which compares a fund’s return to all other funds is assigned. Then, an overall performance score of each fund is the simple average of three percentile ranks obtained from three horizons. For consistency measurement, monthly returns over 12 rolling periods of each fund are calculated. In each period, the percentile rank technique is once again employed. Funds with stable ranking is given high consistency score. Finally, the best fund of each asset class is the one with high score of both performance and consistency.
Performance Score Calculation
Next step is to repeat the previous task of calculating performance score and consistency score to all possible combinations of 3 funds within the same asset class. Then, best group of 3 funds are selected on the same monthly basis.
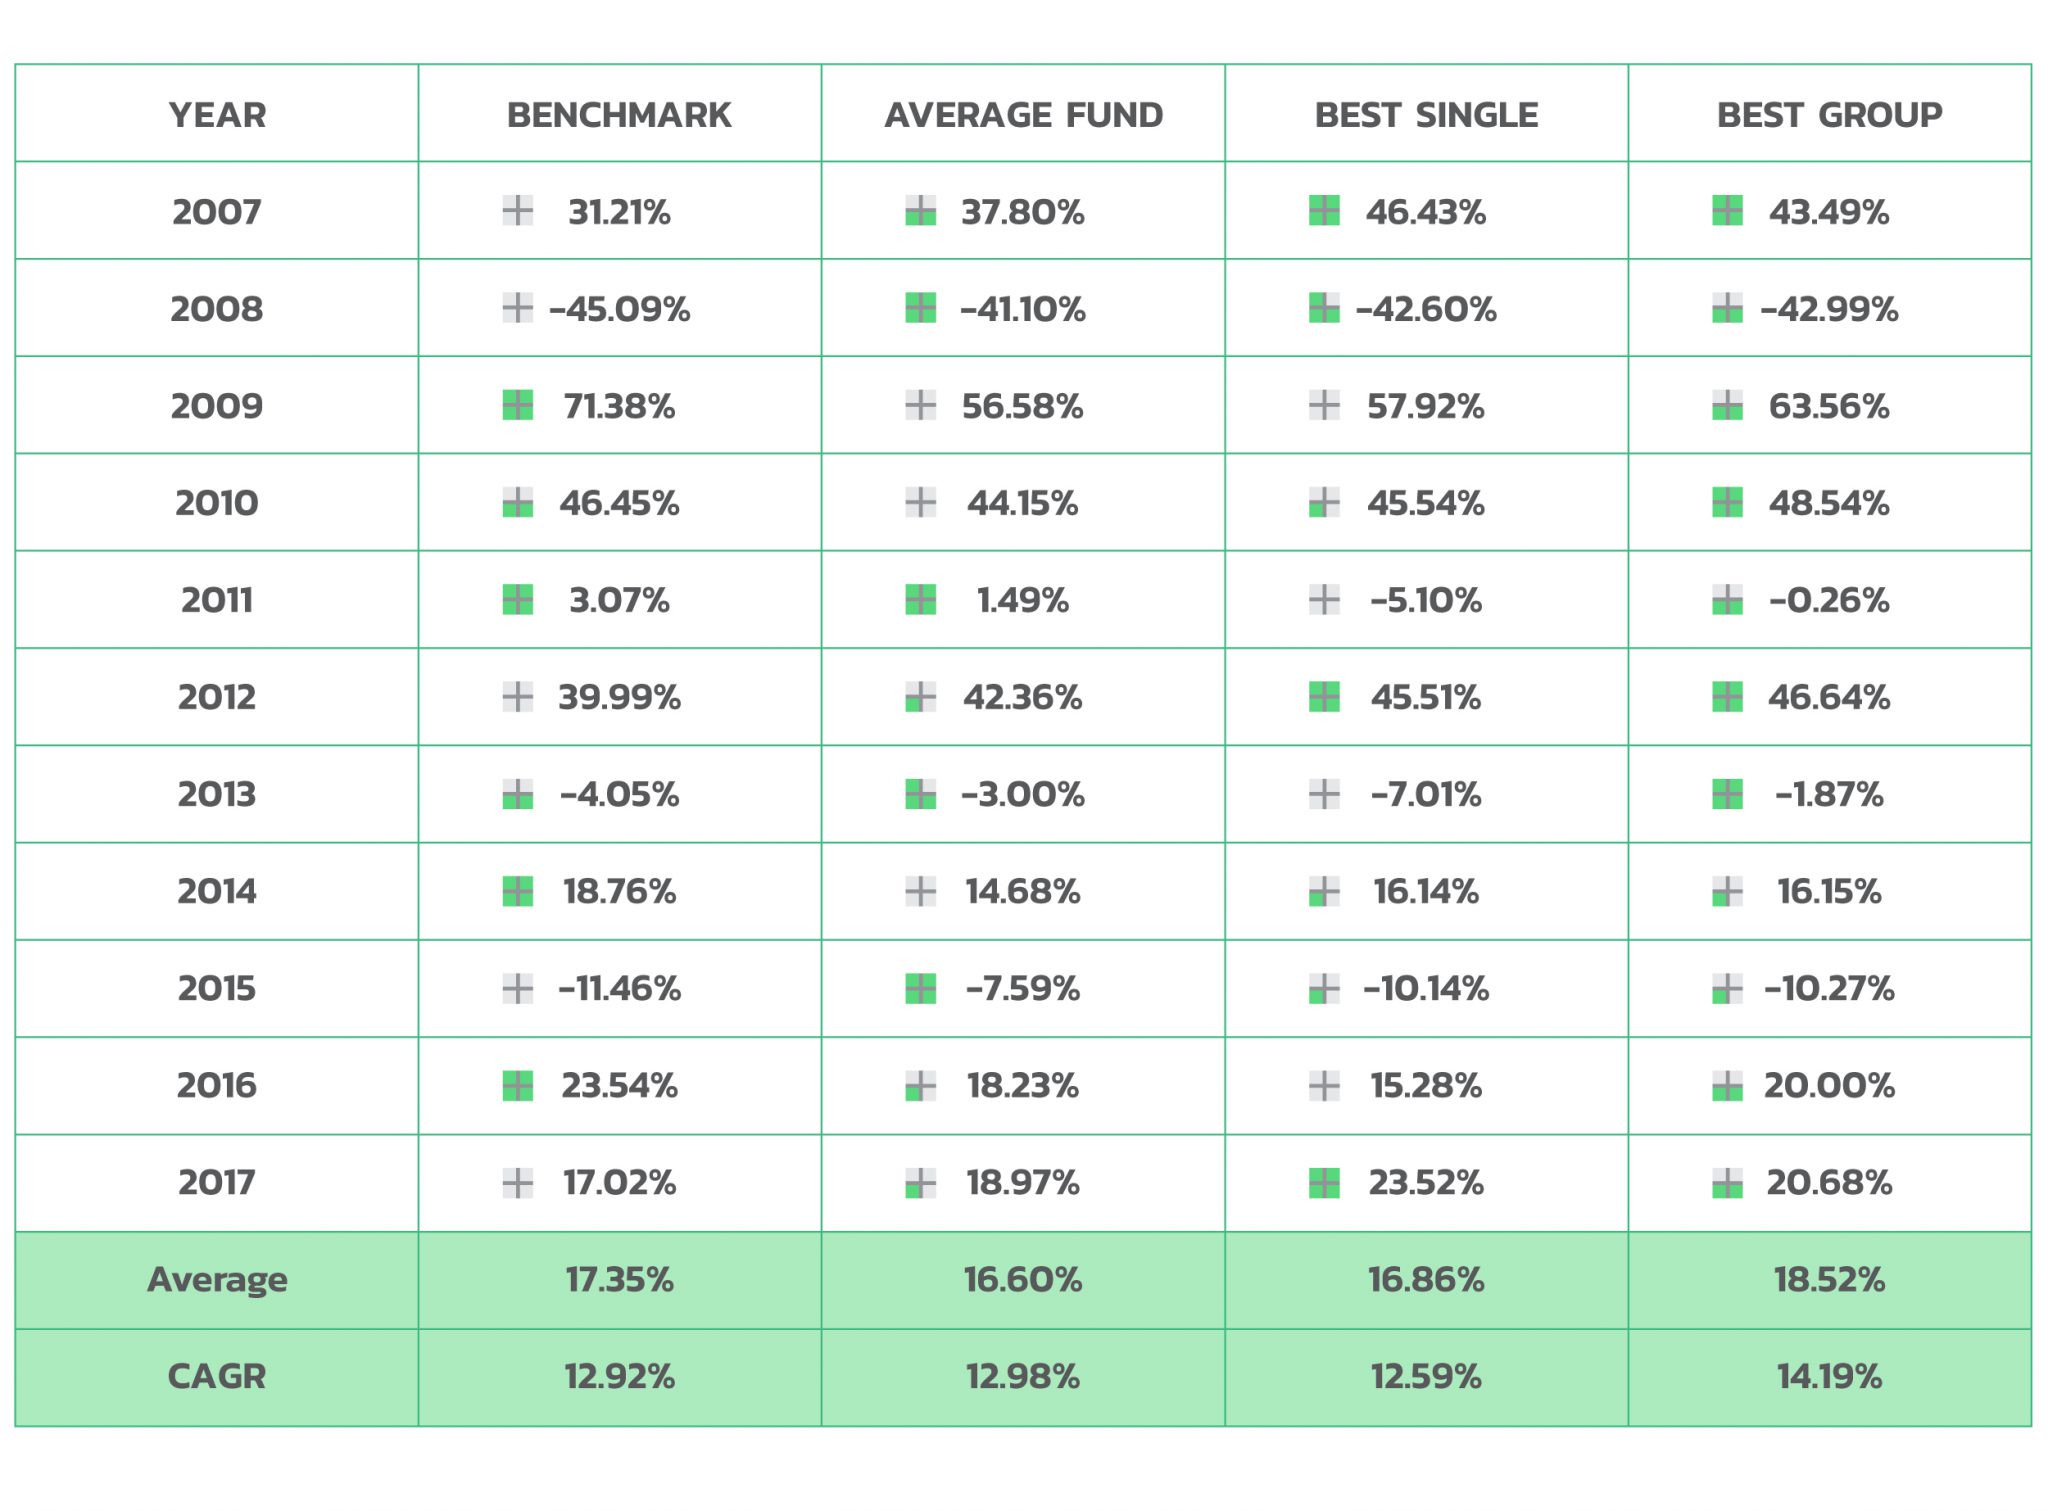
To empirically test our active fund selection technique, we have performed a forward testing to check if a strategy to invest in best single fund can outperform its benchmark. Also, the investment strategy to buy best group of 3 funds are also tested if it can provide a better return than the best single fund strategy.
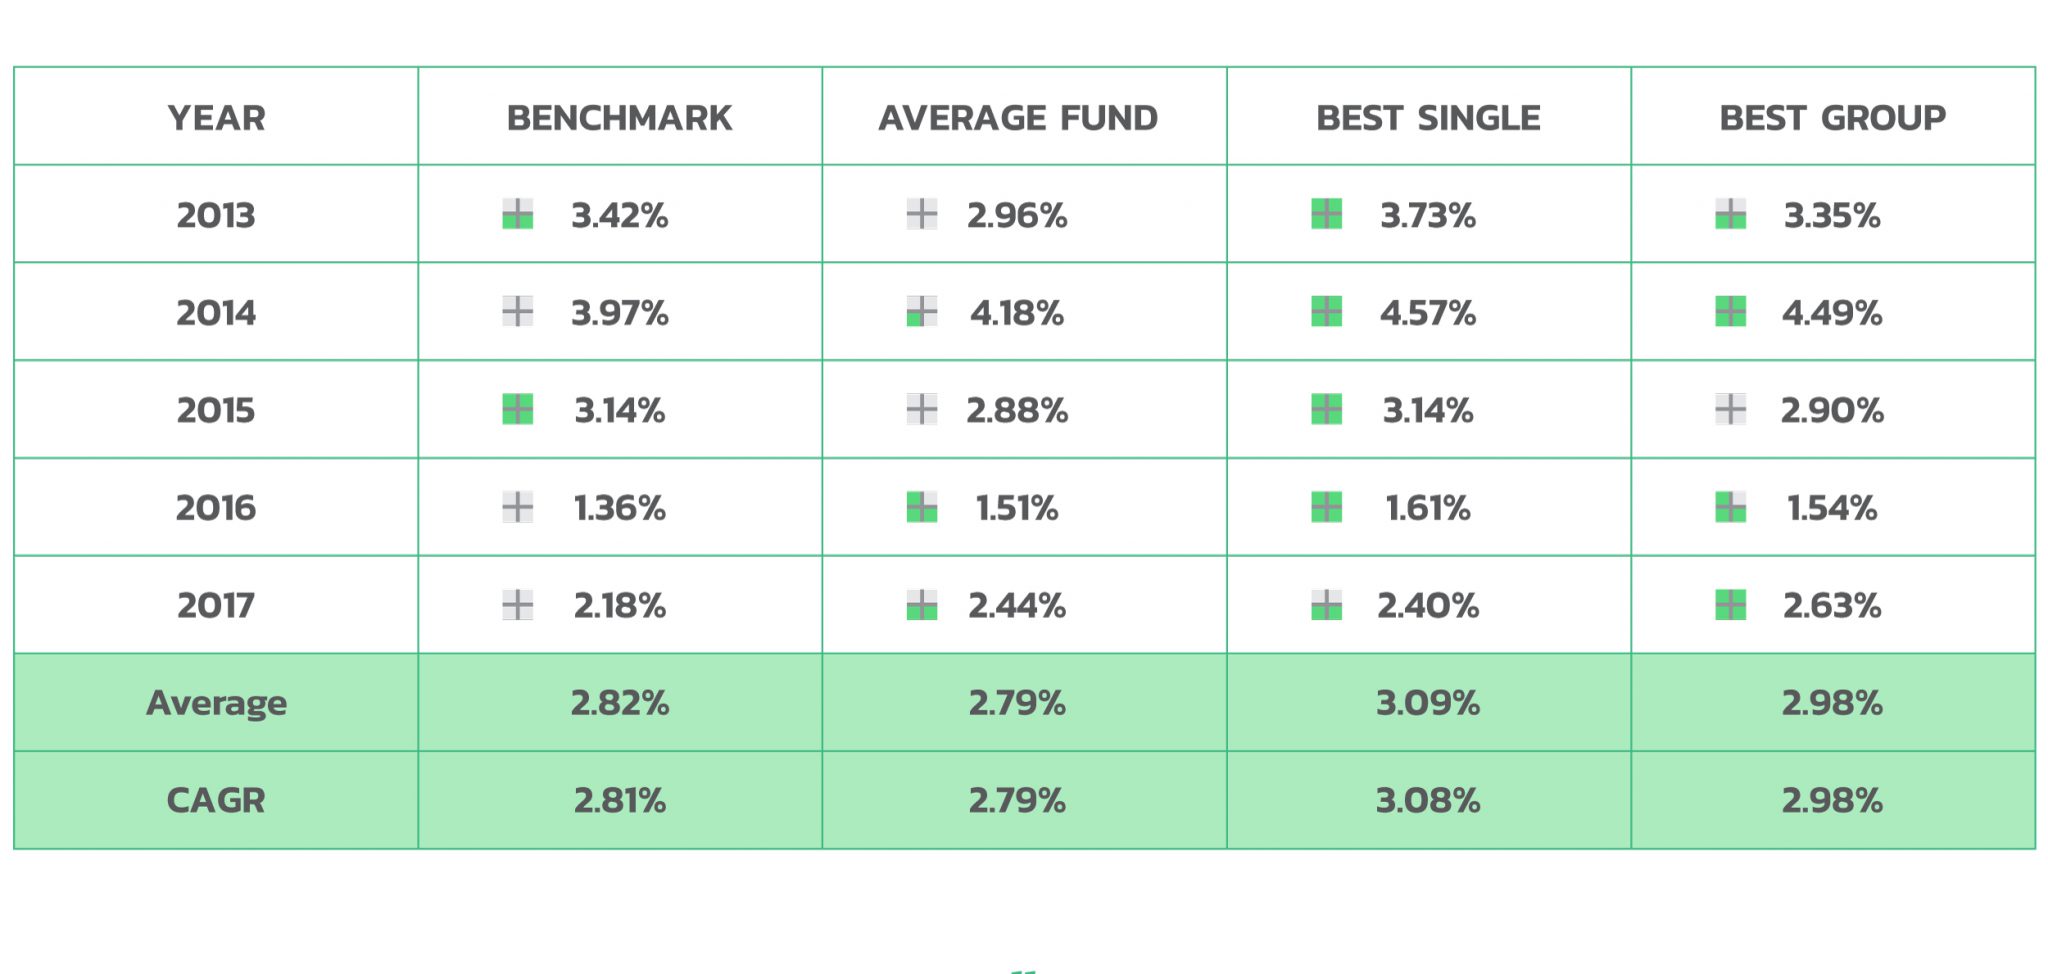
Historical Return of Active Fixed Income Fund Selection Strategy 2013 – 2017
For fixed income funds, investing in the best single fund can outperform the benchmark for five years in a row. However, the strategy to invest in the best group of 3 funds fails to contribute higher return than best single fund strategy. This is mainly due to the fact that best single fund can continuously provide good return and stay on the top list as the best single fund for a long time. It is common to see a particular fixed income fund holding the top rank for more than 12 consecutive months. This superior performance reflects high consistency of fixed income fund manager who can negotiate good deals to buy fixed income securities in OTC market.
Historical Return of Active Equity Fund Selection Strategy 2007 – 2017
For equity funds, investing in the best single fund slightly underperforms the benchmark. In such a highly volatile stock market, best single fund rarely withstands the drastic change in market regime. However, the strategy to constantly invest in the best group of 3 funds can beat the benchmark. Diversification is the key driver for this excess return generation. The combination of decent funds with not-too-high correlations among each other can outperform the best fund.
Part 4: Portfolio Rebalancing
At all times, actual asset allocation of each real account is compared with target asset allocation. Movement in financial markets may cause actual weight of each asset class deviate from its intended target weight. Also, changes in TAA to reflect investment outlook of each asset class require a slight adjustment in target weight. If the actual weight significantly deviates from its target weight, each portfolio will be automatically rebalanced by taking into consideration the rebalancing costs such as front-end and back-end fees.
The best way to minimize effects from the stated transaction fees is to deposit more cash to the portfolio and reinvest dividends received. This technique is called cash flow rebalancing. In odini, this best practice is available for every user as a recurring deposit feature which will automatically deduct cash from mobile banking account to invest in odini portfolio.
When the deposit is made, the predefined automatic algorithm would drive new weight to reach target weight by putting new money into underweighted asset classes first. Once all asset classes reach their optimal target weights, the remaining money will be allocated to each asset class proportionately. This automatic rebalancing is built into the odini to deliver the optimal portfolio which can contribute a sustainable growth in long-term horizon.
email: [email protected]
www.odiniapp.com call: 0 2026 6222
Robowealth Mutual Fund Brokerage Securities Co., Ltd.
6th Floor, Zuellig House Building, 1-7 Silom Road,
Silom, Bangrak, Bangkok 10500, Thailand


